您可以使用 Grafana Cloud 来避免安装、维护和扩展您自己的 Grafana 实例。创建一个免费账户即可开始使用,其中包括永久免费访问 10K 指标、50GB 日志、50GB 跟踪、500VUh k6 测试等。
Prometheus 是一个开源监控系统,Grafana 为其提供开箱即用的支持。本主题将向您介绍在 Grafana 中创建一系列仪表盘的步骤,以显示 Prometheus 监控的服务器的系统指标。
Grafana 和 Prometheus:
(1)下载 Prometheus 和 node_exporter
(2)安装 Prometheus 节点导出器
(3)安装并配置 Prometheus
(4)为 Grafana 配置 Prometheus
(5)在 Grafana Explore 视图中检查 Prometheus 的指标
(6)开始构建仪表盘
下载 Prometheus 和 node_exporter
下载以下组件
与 Grafana 一样,您可以在许多不同的操作系统上安装 Prometheus。请参阅 Prometheus 下载页面,查看 Prometheus 组件的稳定版本列表。
安装 Prometheus node_exporter
在所有要监控的主机上安装 node_exporter。本指南将向您介绍如何在本地安装。
Prometheus node_exporter 是一种广泛使用的工具,用于公开系统指标。有关安装 node_exporter 的说明,请参阅 Prometheus 文档中的安装和运行 node_exporter 部分。
在本地运行 node_exporter 时,请导航至 http://localhost:9100/metrics 以检查它是否正在导出指标。
注意:参考主题中的说明适用于 Linux 用户。您可能需要根据自己的操作系统对说明稍作改动。例如,如果您使用的是 Windows 操作系统,请改用 windows_exporter。
安装和配置 Prometheus
(1)下载 Prometheus 后,解压缩并导航到以下目录:
tar xvfz prometheus-*.tar.gz
cd prometheus-*
(2)找到目录中的 prometheus.yml 文件。
(3)修改 Prometheus 的配置文件,以监控安装了 node_exporter 的主机。
默认情况下,Prometheus 会在当前工作目录下查找 prometheus.yml 文件。这一行为可以通过 --config.file 命令行标志进行更改。例如,一些 Prometheus 安装程序会将配置文件设置为 /etc/prometheus/prometheus.yml。
下面的示例显示了应该添加的代码。请注意,静态配置目标被设置为 ['localhost:9100'],以便在本地运行 node-explorer 时将其作为目标。
# A scrape configuration containing exactly one endpoint to scrape from node_exporter running on a host:
 scrape_configs:
     # The job name is added as a label `job=<job_name>` to any timeseries scraped from this config.
     - job_name: 'node'

     # metrics_path defaults to '/metrics'
     # scheme defaults to 'http'.

       static_configs:
       - targets: ['localhost:9100']
(1)启动 Prometheus 服务:
./prometheus --config.file=./prometheus.yml
(2)通过导航至 http://localhost:9090 确认 Prometheus 正在运行。
您可以看到 node_exporter 指标已被发送到 Prometheus。接下来,指标将被发送到 Grafana。
为 Grafana 配置 Prometheus
在本地运行 Prometheus 时,有两种为 Grafana 配置 Prometheus 的方法。您可以使用 Grafana Cloud 上的托管 Grafana 实例,也可以在本地运行 Grafana。
本指南介绍在 Grafana Cloud 上的托管 Grafana 实例中配置 Prometheus。
(1)注册 https://grafana.com/。Grafana 会为您提供一个开箱即用的 Prometheus 实例。
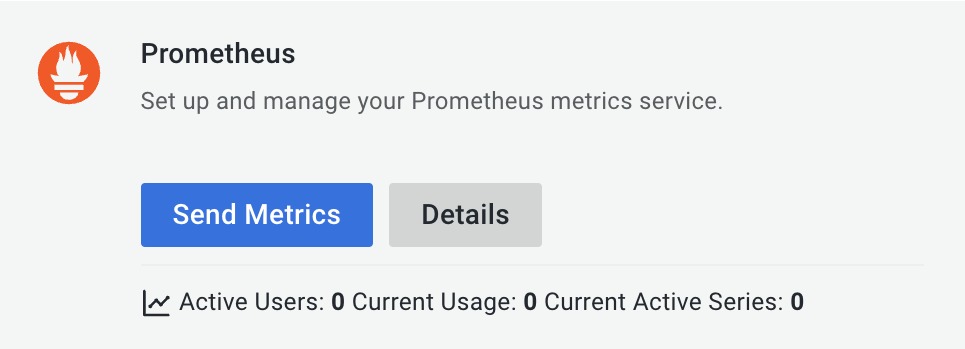
(2)由于您是在本地运行自己的 Prometheus 实例,因此必须将度量指标远程写入 Grafana.com Prometheus 实例。Grafana 提供了可添加到您的 prometheus.yml 配置文件的代码。其中包括远程写入端点、用户名和密码。
在您的 prometheus.yml 文件中添加以下代码,以开始向您托管的 Grafana 实例发送度量指标。
remote_write:
- url: <https://your-remote-write-endpoint>
  basic_auth:
    username: <your user name>
    password: <Your Grafana.com API Key>
注意:若要将 Prometheus 实例配置为在本地而非 Grafana Cloud 上使用 Grafana,请在此处安装 Grafana 并按照此处列出的配置步骤进行操作。
在 Grafana Explore 视图中检查 Prometheus 指标
在您的 Grafana 实例中,转到 "Explore" 视图并构建查询,以实验您要监控的指标。在这里,您还可以调试与从 Prometheus 收集指标相关的问题。
开始创建仪表板
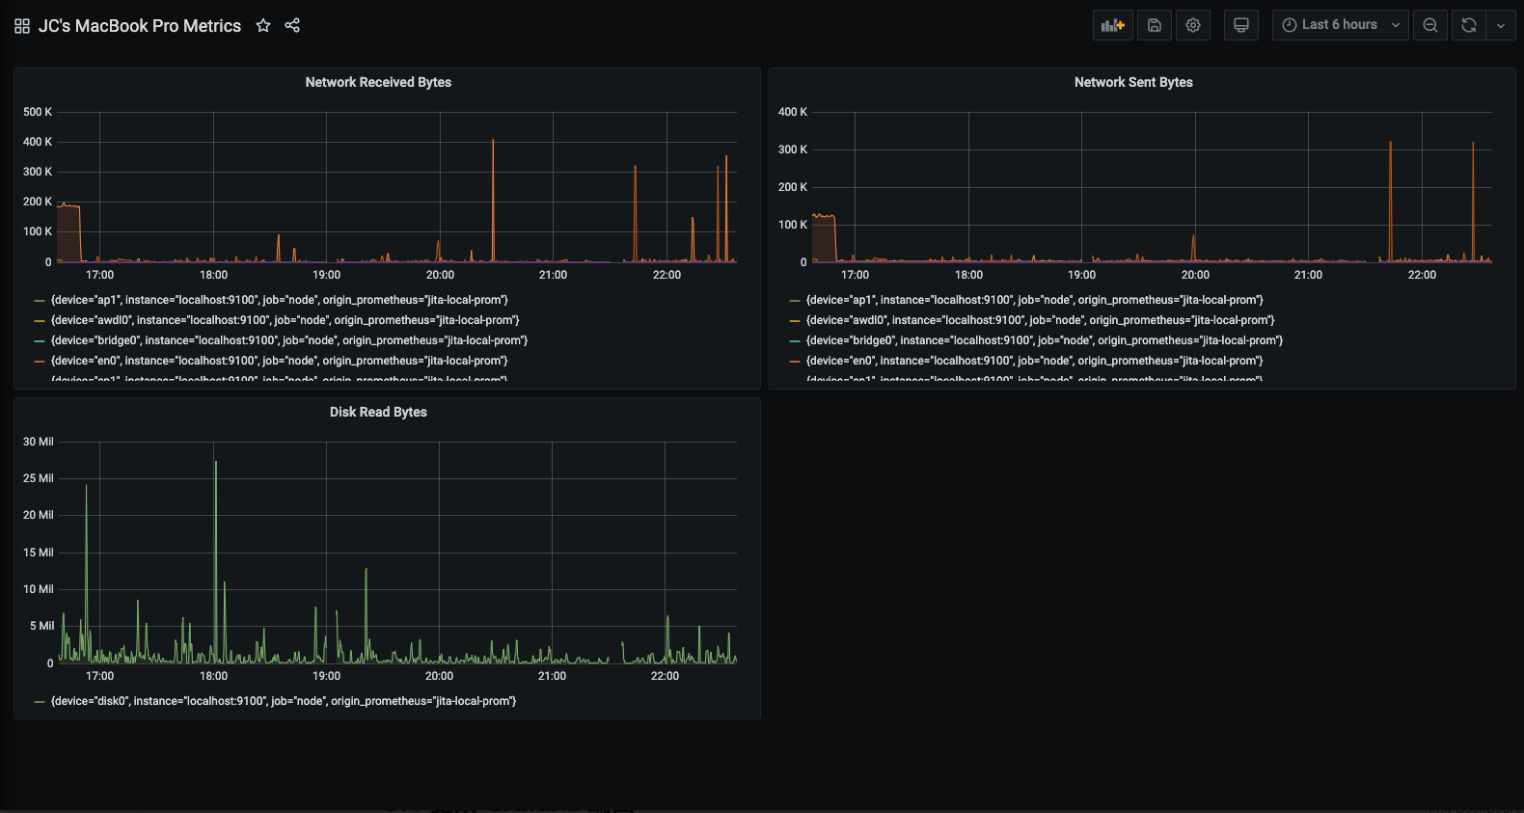
现在您已经有了一个经过整理的查询列表,可以创建仪表盘来显示 Prometheus 监控的系统指标。安装 Prometheus 和 node_exporter 或 windows_exporter 时,会发现推荐使用的仪表盘。
下图显示了一个包含三个面板的仪表盘,其中显示了一些系统指标。
了解更多信息:

 川公网安备51010802032098