状态历史记录显示一段时间内的周期性状态。每个字段或系列都以水平行的形式呈现。每个值周围都有方框并居中显示。

一个示例
该示例使用 mysql 作为数据源,假如存在如下数据表格:

该数据表的 SQL 语句如下:
CREATE TABLE `status_history_data` (
  `id` int(10) unsigned NOT NULL AUTO_INCREMENT,
  `time` datetime DEFAULT NULL,
  `cellar` decimal(10,6) DEFAULT NULL,
  `living` decimal(10,6) DEFAULT NULL,
  `porch` decimal(10,6) DEFAULT NULL,
  `bedroom` decimal(10,6) DEFAULT NULL,
  `guest` decimal(10,6) DEFAULT NULL,
  `kitchen` decimal(10,6) DEFAULT NULL,
  PRIMARY KEY (`id`)
) ENGINE=InnoDB DEFAULT CHARSET=utf8mb4;
对应的数据 SQL 如下:
INSERT INTO `status_history_data` (`id`, `time`, `cellar`, `living`, `porch`, `bedroom`, `guest`, `kitchen`) VALUES (1, '2024-05-01 12:30:00', -7.585553, 6.496344, -6.505837, 0.613584, -9.879883, 9.510103);
INSERT INTO `status_history_data` (`id`, `time`, `cellar`, `living`, `porch`, `bedroom`, `guest`, `kitchen`) VALUES (2, '2024-05-02 12:30:00', -2.016574, -7.792400, -2.402406, -6.832111, -0.627454, 3.404901);
INSERT INTO `status_history_data` (`id`, `time`, `cellar`, `living`, `porch`, `bedroom`, `guest`, `kitchen`) VALUES (3, '2024-05-03 12:30:00', 1.179259, -9.178573, 5.288765, -6.617610, -7.996963, 0.158420);
INSERT INTO `status_history_data` (`id`, `time`, `cellar`, `living`, `porch`, `bedroom`, `guest`, `kitchen`) VALUES (4, '2024-05-04 12:30:00', 2.149224, -9.383136, -6.697118, 9.898901, 3.258654, -2.304961);
INSERT INTO `status_history_data` (`id`, `time`, `cellar`, `living`, `porch`, `bedroom`, `guest`, `kitchen`) VALUES (5, '2024-05-05 12:30:00', 2.188742, 7.388495, -5.154540, -0.993438, -2.471510, 5.838373);
INSERT INTO `status_history_data` (`id`, `time`, `cellar`, `living`, `porch`, `bedroom`, `guest`, `kitchen`) VALUES (6, '2024-05-06 12:30:00', 0.371251, 1.681314, -4.799395, -8.242544, 9.402363, 7.252457);
INSERT INTO `status_history_data` (`id`, `time`, `cellar`, `living`, `porch`, `bedroom`, `guest`, `kitchen`) VALUES (7, '2024-05-07 12:30:00', 9.273150, 5.582765, -3.233384, 1.322777, -1.474213, 1.973779);
INSERT INTO `status_history_data` (`id`, `time`, `cellar`, `living`, `porch`, `bedroom`, `guest`, `kitchen`) VALUES (8, '2024-05-08 12:30:00', -7.059034, 5.488169, 8.204830, -9.941820, -3.279471, -6.469342);
INSERT INTO `status_history_data` (`id`, `time`, `cellar`, `living`, `porch`, `bedroom`, `guest`, `kitchen`) VALUES (9, '2024-05-09 12:30:00', 7.204547, 4.997920, 7.444315, 9.904222, -8.458448, 6.929797);
INSERT INTO `status_history_data` (`id`, `time`, `cellar`, `living`, `porch`, `bedroom`, `guest`, `kitchen`) VALUES (10, '2024-05-10 12:30:00', -6.231963, -1.616415, -1.821783, 7.865970, 8.123446, 0.118769);
INSERT INTO `status_history_data` (`id`, `time`, `cellar`, `living`, `porch`, `bedroom`, `guest`, `kitchen`) VALUES (11, '2024-05-11 12:30:00', -2.328067, -0.463112, -6.308268, -1.921356, 2.113650, 7.713179);
INSERT INTO `status_history_data` (`id`, `time`, `cellar`, `living`, `porch`, `bedroom`, `guest`, `kitchen`) VALUES (12, '2024-05-12 12:30:00', 2.216735, -4.894199, -7.312131, -2.728955, -9.072019, -3.289320);
INSERT INTO `status_history_data` (`id`, `time`, `cellar`, `living`, `porch`, `bedroom`, `guest`, `kitchen`) VALUES (13, '2024-05-13 12:30:00', 8.070474, -9.004180, 1.600613, -6.270146, 4.371386, 9.707482);
INSERT INTO `status_history_data` (`id`, `time`, `cellar`, `living`, `porch`, `bedroom`, `guest`, `kitchen`) VALUES (14, '2024-05-14 12:30:00', -8.452796, -1.059261, 9.747720, -0.455581, -4.562767, 8.030692);
INSERT INTO `status_history_data` (`id`, `time`, `cellar`, `living`, `porch`, `bedroom`, `guest`, `kitchen`) VALUES (15, '2024-05-15 12:30:00', 3.264028, 6.180254, 7.054571, -3.297719, -6.457446, 8.479570);
INSERT INTO `status_history_data` (`id`, `time`, `cellar`, `living`, `porch`, `bedroom`, `guest`, `kitchen`) VALUES (16, '2024-05-16 12:30:00', -9.002423, -7.269749, -4.102525, 3.252297, 7.048603, -3.551172);
INSERT INTO `status_history_data` (`id`, `time`, `cellar`, `living`, `porch`, `bedroom`, `guest`, `kitchen`) VALUES (17, '2024-05-17 12:30:00', 0.232532, 0.491277, 4.744592, -0.215610, -4.781278, -3.348623);
INSERT INTO `status_history_data` (`id`, `time`, `cellar`, `living`, `porch`, `bedroom`, `guest`, `kitchen`) VALUES (18, '2024-05-18 12:30:00', 9.071262, 7.993116, -6.223522, -5.392833, -5.647161, -3.922867);
INSERT INTO `status_history_data` (`id`, `time`, `cellar`, `living`, `porch`, `bedroom`, `guest`, `kitchen`) VALUES (19, '2024-05-19 12:30:00', -9.030827, -8.501236, -2.427091, -3.448675, 4.488026, -8.826609);
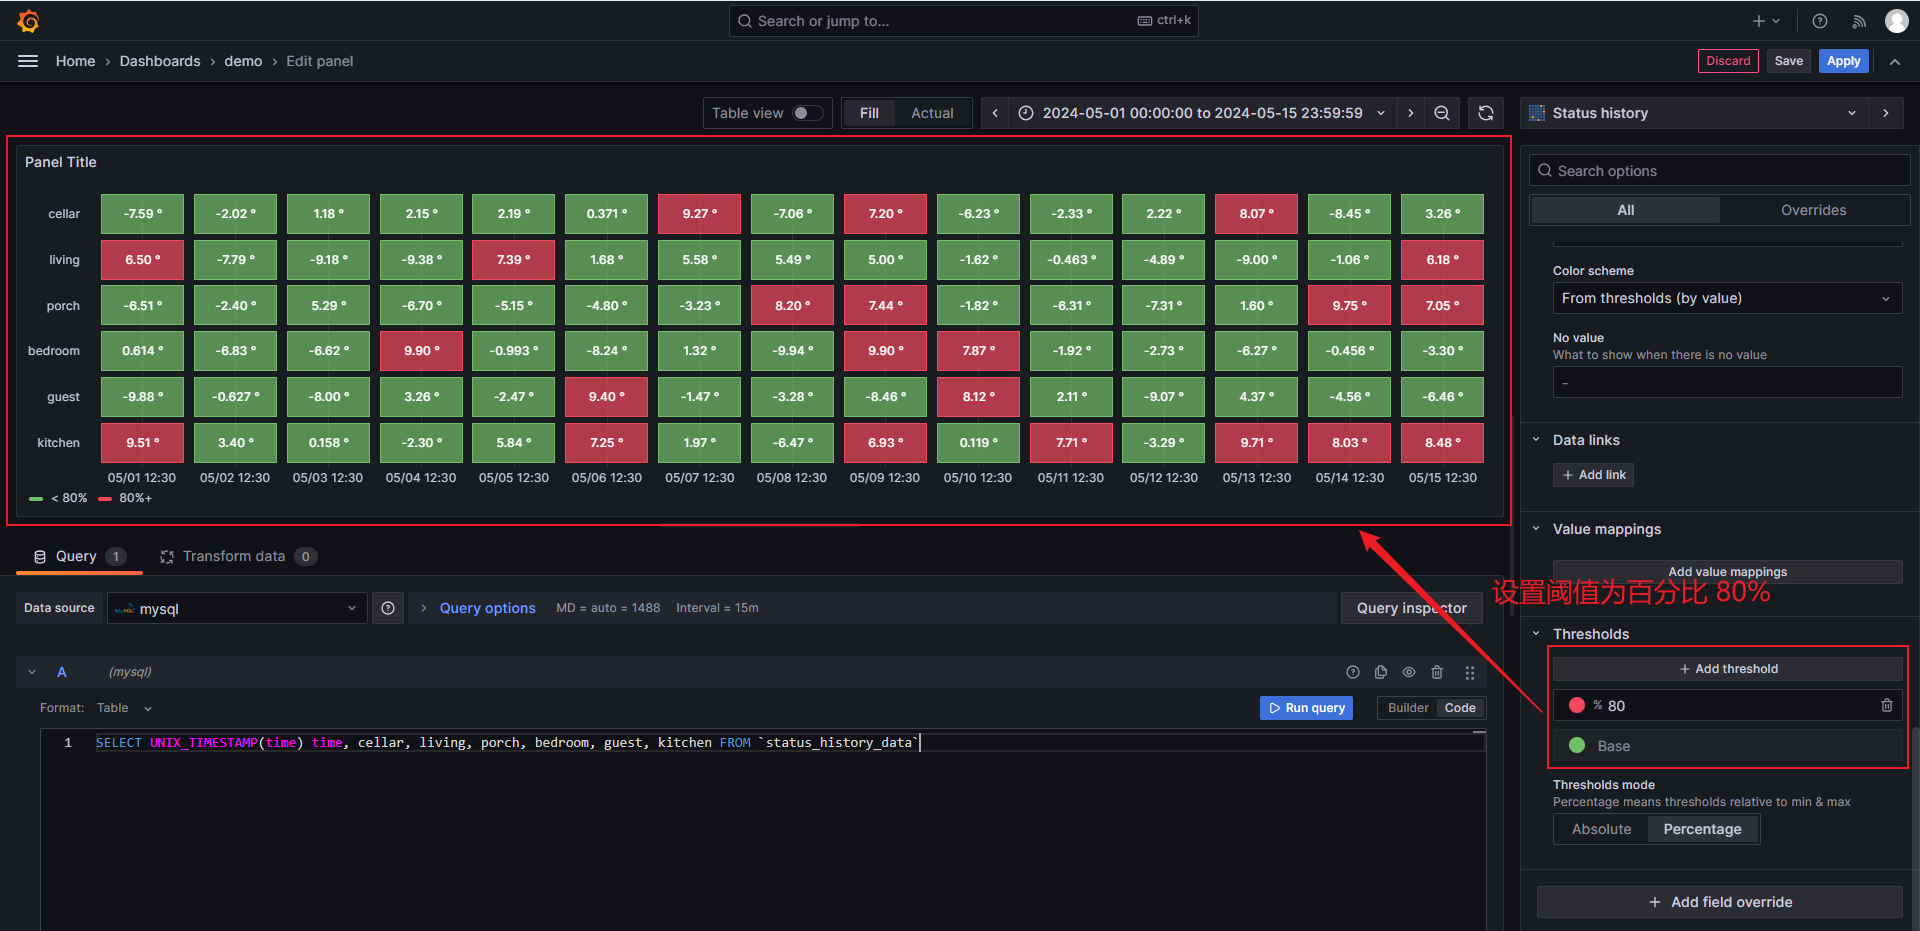
最后,打开 Grafana,创建状态历史图表,使用如下 SQL 作为图表的数据:
SELECT UNIX_TIMESTAMP(time) time, cellar, living, porch, bedroom, guest, kitchen FROM `status_history_data`
点击“ ”按钮,执行上面的 SQL,效果如下图:

Supported data(支持的数据)
状态历史记录可使用字符串、布尔和数值字段或时间序列。时间字段是必需的。您可以使用值映射为字符串着色,或为数值范围分配文本值。
公共广告位-后端
Display options(显示选项)
使用这些选项可完善可视化效果。
Show values(显示值)
控制是否在数值框内显示数值。如果有足够的空间,将自动显示数值。
Column width(列宽)
控制方框的宽度。1 = 最大空间,0 = 最小空间。
Line width(线宽)
控制状态区域的线宽。
Fill opacity(填充不透明度)
控制状态区域的不透明度。
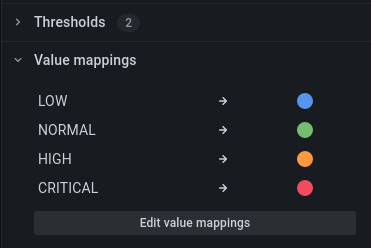
Value mappings(值映射)
要为布尔值或字符串值指定颜色,请使用值映射。

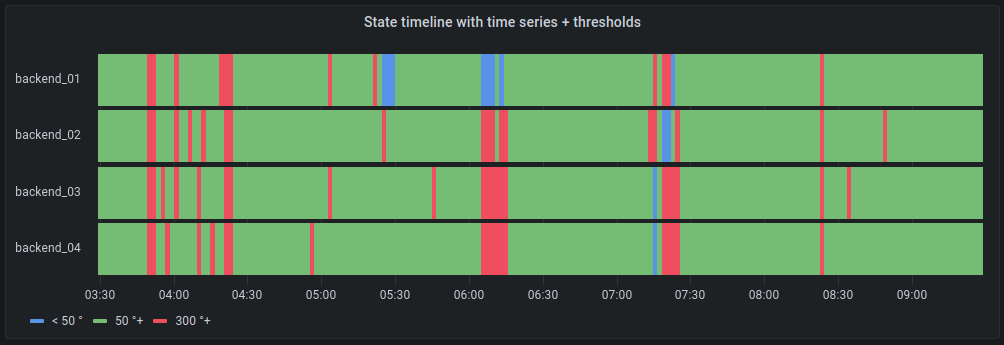
Time series data with thresholds(带阈值的时间序列数据)
可视化还可用于时间序列数据。在这种情况下,阈值用于为方框着色。您还可以使用渐变配色方案为值着色。

Legend options(图例选项)
启用图例选项后,可以显示值映射或阈值括号。要在图例中显示值映射,必须将 "Color scheme" 中的配色方案设置为 "Single color" 或 "Classic palette"。要在图例中显示阈值括号,则需将色彩方案设置为 "From thresholds"。
Legend mode(图例模式)
使用这些设置可定义图例在可视化中的显示方式。
Legend placement(图例位置)
选择显示图例的位置。
Bottom - 图表下方。
Right - 图表右侧。
Legend values(图例值)
选择要在图例中显示的标准计算值,可以有多个。


 ”按钮,执行上面的 SQL,效果如下图:


