趋势图(Trend),又称为推移图或时间序列图,是一种统计图表,其以时间为横轴,观察变量为纵轴,用于反映时间与数量之间的关系,观察变量变化发展的趋势及偏差。这种图表类型的主要目的是观察特定变量是否随时间变化而呈现出某种趋势。
趋势图一般以折线图的形式来表现,横轴上的时间单位可以是小时、日、月、年等,且各时间点应连续不间断。而纵轴上的观察变量则可以是绝对量、平均值、发生率等。通过数据点在图上的连续标记与连接,可以清晰地看出数据随时间的变化趋势。
趋势图在多个领域有广泛的应用,尤其在企业管理中,其具有以下重要作用:
观察发展趋势:通过趋势图,管理者可以直观地看到数据随时间的变化情况,如销售额的增长、产品不良率的降低等,从而及时把握管理效果或产品性能参数的动态趋势。
探索影响因素:当数据出现明显的上升或下降趋势时,趋势图有助于分析可能的影响因素,如市场需求的季节性变化、生产过程中的工艺改进等。
评价干预效果:在实施某项干预措施(如营销策略调整、生产流程优化)后,通过对比干预前后的趋势图,可以客观评价这些措施的实际效果。
预测与应对:基于历史数据的趋势分析,企业可以对未来可能出现的情况进行预测,并提前制定相应的应对策略。
一个示例
该示例将使用 mysql 作为数据源,假如存在一张存储近30日的温度表,表SQL语句如下:
CREATE TABLE `trend_data` (
  `id` int(11) unsigned NOT NULL AUTO_INCREMENT,
  `days` int(11) DEFAULT NULL COMMENT '日',
  `temperature` decimal(10,2) DEFAULT NULL COMMENT '温度℃',
  PRIMARY KEY (`id`)
);
向表中插入近30日的温度数据,SQL语句如下:
INSERT INTO `trend_data` (`id`, `days`, `temperature`) VALUES (1, 1, 27.05);
INSERT INTO `trend_data` (`id`, `days`, `temperature`) VALUES (2, 2, 23.22);
INSERT INTO `trend_data` (`id`, `days`, `temperature`) VALUES (3, 3, 25.25);
INSERT INTO `trend_data` (`id`, `days`, `temperature`) VALUES (4, 4, 22.33);
INSERT INTO `trend_data` (`id`, `days`, `temperature`) VALUES (5, 5, 23.20);
INSERT INTO `trend_data` (`id`, `days`, `temperature`) VALUES (6, 6, 24.50);
INSERT INTO `trend_data` (`id`, `days`, `temperature`) VALUES (7, 7, 22.50);
INSERT INTO `trend_data` (`id`, `days`, `temperature`) VALUES (8, 8, 27.20);
INSERT INTO `trend_data` (`id`, `days`, `temperature`) VALUES (9, 9, 28.40);
INSERT INTO `trend_data` (`id`, `days`, `temperature`) VALUES (10, 10, 29.50);
INSERT INTO `trend_data` (`id`, `days`, `temperature`) VALUES (11, 11, 21.70);
INSERT INTO `trend_data` (`id`, `days`, `temperature`) VALUES (12, 12, 20.12);
INSERT INTO `trend_data` (`id`, `days`, `temperature`) VALUES (13, 13, 24.50);
INSERT INTO `trend_data` (`id`, `days`, `temperature`) VALUES (14, 14, 27.58);
INSERT INTO `trend_data` (`id`, `days`, `temperature`) VALUES (15, 15, 22.70);
INSERT INTO `trend_data` (`id`, `days`, `temperature`) VALUES (16, 16, 26.30);
INSERT INTO `trend_data` (`id`, `days`, `temperature`) VALUES (17, 17, 25.40);
INSERT INTO `trend_data` (`id`, `days`, `temperature`) VALUES (18, 18, 24.20);
INSERT INTO `trend_data` (`id`, `days`, `temperature`) VALUES (19, 19, 27.33);
INSERT INTO `trend_data` (`id`, `days`, `temperature`) VALUES (20, 20, 26.17);
INSERT INTO `trend_data` (`id`, `days`, `temperature`) VALUES (21, 21, 25.72);
INSERT INTO `trend_data` (`id`, `days`, `temperature`) VALUES (22, 22, 24.22);
INSERT INTO `trend_data` (`id`, `days`, `temperature`) VALUES (23, 23, 23.71);
INSERT INTO `trend_data` (`id`, `days`, `temperature`) VALUES (24, 24, 26.37);
INSERT INTO `trend_data` (`id`, `days`, `temperature`) VALUES (25, 25, 25.00);
INSERT INTO `trend_data` (`id`, `days`, `temperature`) VALUES (26, 26, 24.80);
INSERT INTO `trend_data` (`id`, `days`, `temperature`) VALUES (27, 27, 26.22);
INSERT INTO `trend_data` (`id`, `days`, `temperature`) VALUES (28, 28, 25.12);
INSERT INTO `trend_data` (`id`, `days`, `temperature`) VALUES (29, 29, 22.22);
INSERT INTO `trend_data` (`id`, `days`, `temperature`) VALUES (30, 30, 25.40);
最后,打开 Grafana,新建一个 Trend 图表,使用如下 SQL 查询数据:
select days,temperature from grafana.trend_data order by days asc
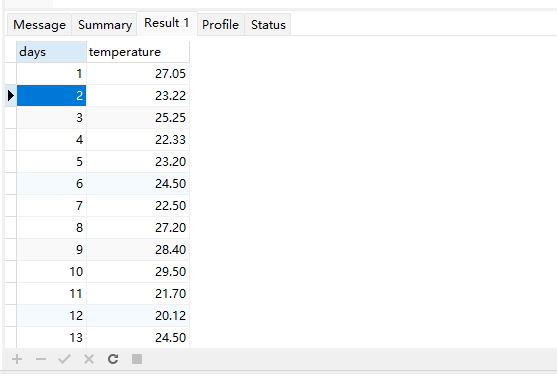
运行上述 SQL,数据如下图:
如果将上述 SQL 用作 Trend 图表的数据来源,效果如下图:
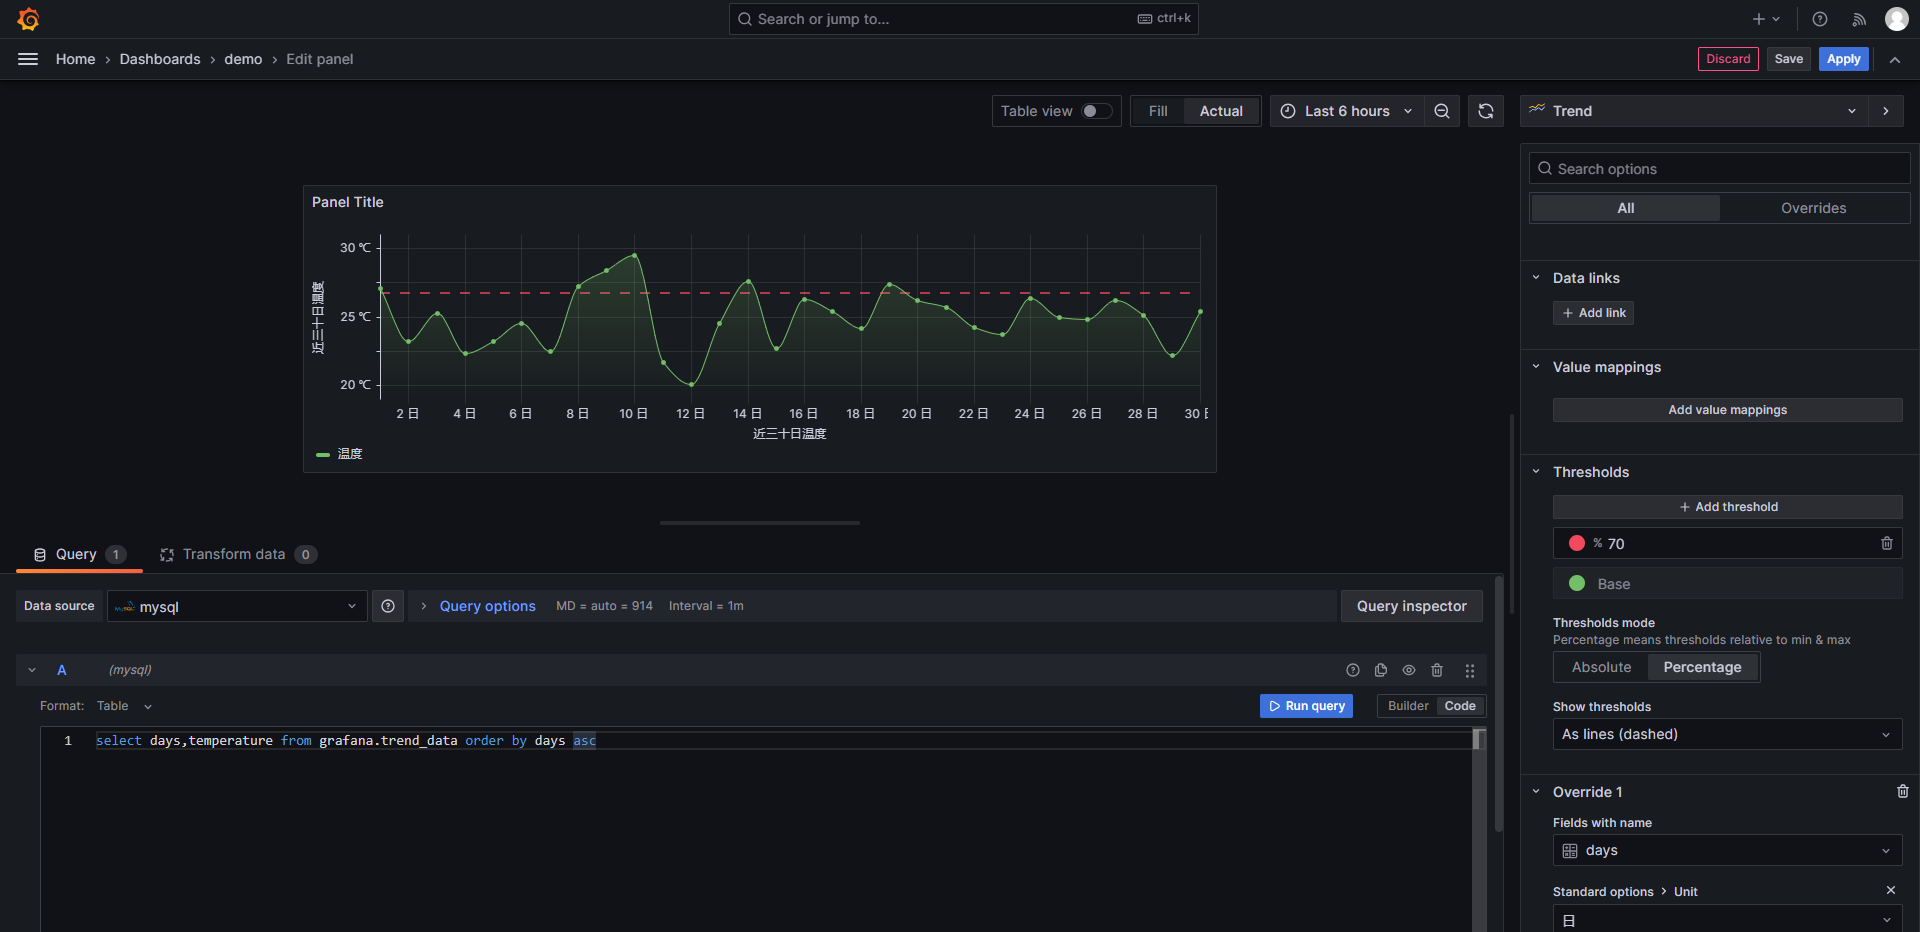
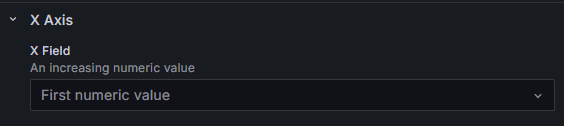
注意,X轴字段必须是数字,而且是递增的,你可以通过“X Field selection”选择。
公共广告位-后端
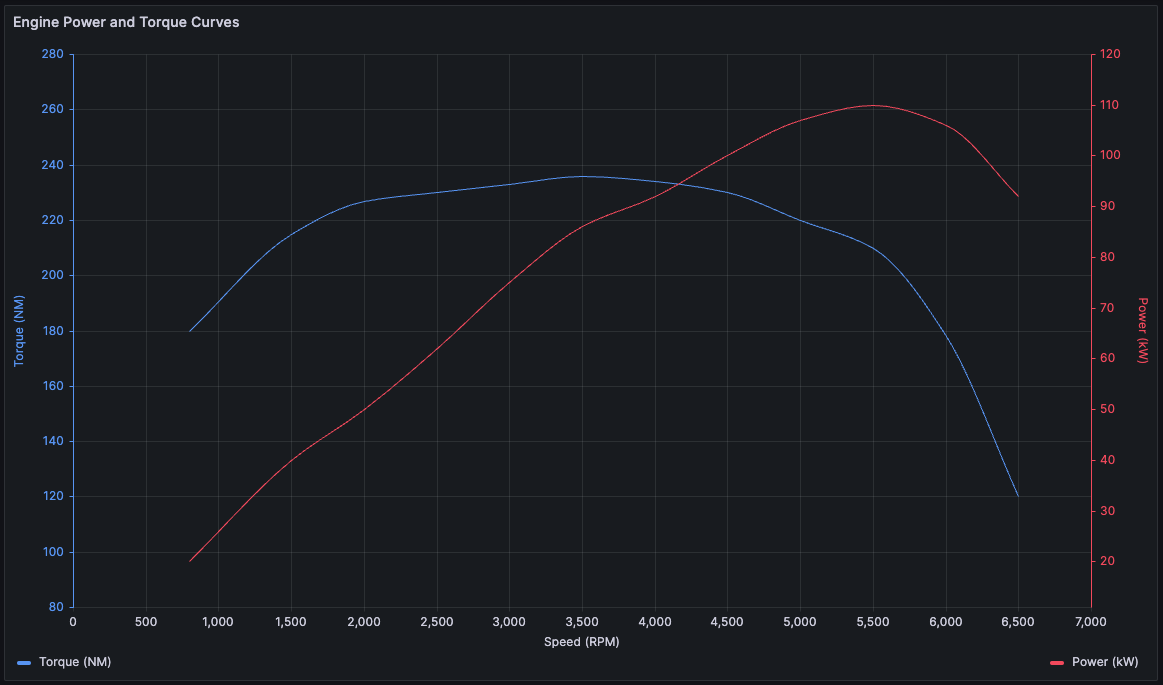
X Field selection(X 字段选择)
使用此选项可选择包含递增数值的字段。
例如,可以表示发动机功率和扭矩与速度的关系,其中速度绘制在 x 轴上,功率和扭矩绘制在 y 轴上。

 川公网安备51010802032098