这里就不多说了,直接贴源码:
示例:
<html lang="en">
<head>
<meta charset="UTF-8">
<meta name="viewport" content="width=device-width, initial-scale=1.0">
<title>ECharts3 学习</title>
<script src="https://www.hxstrive.com/cdn/libs/echarts/3.8.5/echarts.js"></script>
</head>
<body>
<div id="main" style="width: 600px;height:400px;"></div>
<script type="text/javascript">
var myChart = echarts.init(document.getElementById('main'));
myChart.setOption({
// 配置 X 坐标轴
xAxis: {
type: 'category',
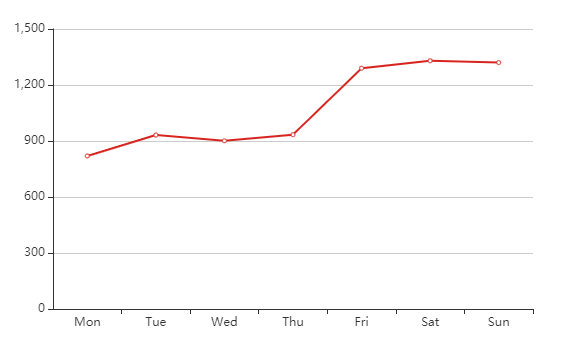
data: ['Mon', 'Tue', 'Wed', 'Thu', 'Fri', 'Sat', 'Sun']
},
// 配置 Y 坐标轴
yAxis: {
type: 'value'
},
series: [{
// 设置数据
data: [820, 932, 901, 934, 1290, 1330, 1320],
// 设置图标类型为折线图
type: 'line'
}]
});
</script>
</body>
</html>
👉自己动手试一试 »
运行效果:


 川公网安备51010802032098