实现柱状图背景颜色渐变,需要用到 new echarts.graphic.LinearGradient(x0, y0, x1, y1, data) 方法。

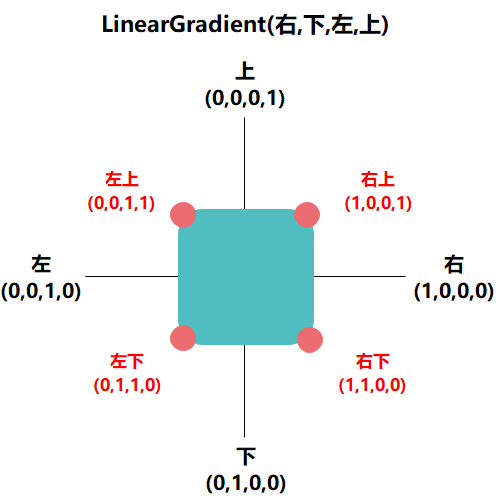
LinearGradient方法前4个参数用于配置渐变色的起止位置,这4个参数依次对应右/下/左/上四个方位。而“0 0 0 1”则代表渐变色从正上方开始。方法参数列表:
实例:
new echarts.graphic.LinearGradient(1, 0, 0, 0, data) 表示从右到左渐变
new echarts.graphic.LinearGradient(0, 1, 0, 0, data) 表示从底到上渐变
new echarts.graphic.LinearGradient(0, 0, 1, 0, data) 表示从左到右渐变
new echarts.graphic.LinearGradient(0, 0, 0, 1, data) 表示从上到下渐变
new echarts.graphic.LinearGradient(1, 1, 0, 0, data) 表示从右下角到左上角
new echarts.graphic.LinearGradient(0, 0, 1, 1, data) 表示从左上角到右下角
new echarts.graphic.LinearGradient(0, 1, 1, 0, data) 表示从左下角到右上角
new echarts.graphic.LinearGradient(1, 0, 0, 1, data) 表示从右上角到左下角
公共广告位-前端
具体用法见下面实例:
HTML代码:
<!DOCTYPE html>
<html lang="en">
<head>
    <meta charset="UTF-8">
    <title>ECharts3 学习</title>
    <link rel="icon" href="favicon.ico" type="image/x-icon" id="../../page_favionc">
    <script src="../../public/js/echarts3/echarts.js"></script>
</head>
<body>
<div id="main" style="width: 900px;height:500px;"></div>
<script type="text/javascript">
    // JS代码见“JavaScript代码”块
</script>
</body>
</html>
JavaScript代码:
var myChart = echarts.init(document.getElementById('main'));
var option = {
    tooltip: {
        trigger: 'axis',
        axisPointer: {
            type: 'cross',
            crossStyle: {
                color: '#999'
            }
        }
    },
    xAxis: [
        {
            type: 'category',
            data: ['1月','2月','3月','4月','5月','6月','7月','8月','9月','10月','11月','12月'],
            axisPointer: {
                type: 'shadow'
            }
        }
    ],
    yAxis: [
        {
            type: 'value',
            name: '水量',
            min: 0,
            max: 250,
            interval: 50,
            axisLabel: {
                formatter: '{value} ml'
            }
        }
    ],
    series: [{
        name: '降雨量',
        type: 'bar',
        data: [30, 60, 65, 78, 67, 120, 144, 234, 102, 87, 35, 27], // 数据
        itemStyle: {
            normal: {
                color: new echarts.graphic.LinearGradient(
                    0, 0, 0, 1, // 相当于2点的位置 A(0, 0)  B(1, 0)
                    [
                        {offset: 0, color: '#F8D3C7'}, // 柱图渐变色
                        {offset: 0.5, color: '#F3AA8D'}, // 柱图渐变色
                        {offset: 1, color: '#D26D2B'}, // 柱图渐变色
                    ]
                )
            },
            emphasis: {
                color: new echarts.graphic.LinearGradient(
                    0, 0, 0, 1,
                    [
                        {offset: 0, color: '#E8B5C3'}, // 柱图高亮渐变色
                        {offset: 0.7, color: '#CA7490'}, // 柱图高亮渐变色
                        {offset: 1, color: '#A3526D'} // 柱图高亮渐变色
                    ]
                )
            }
        },
    }]
};
myChart.setOption(option);
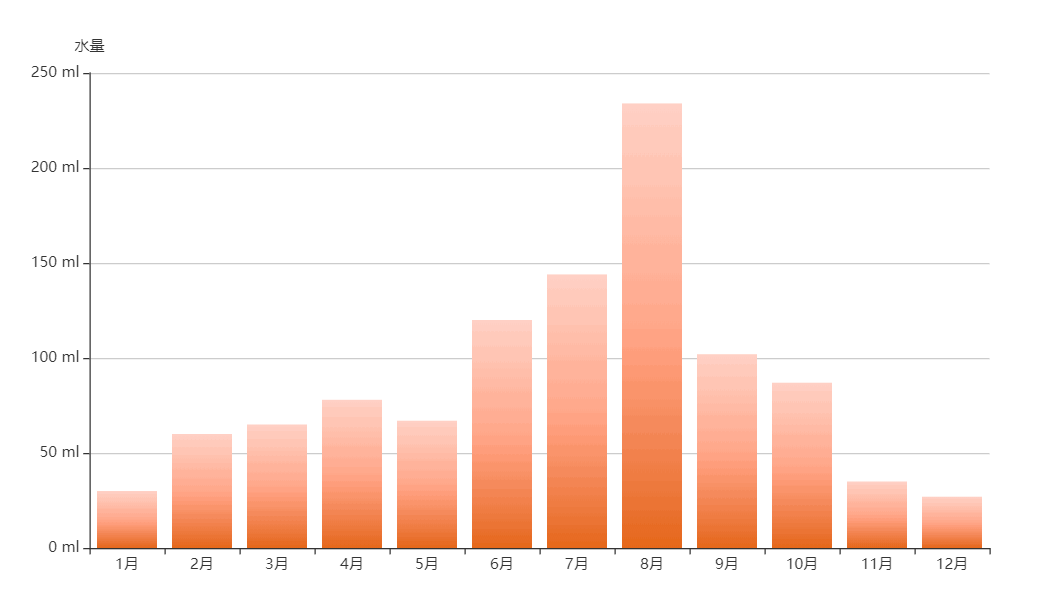
效果图如下:

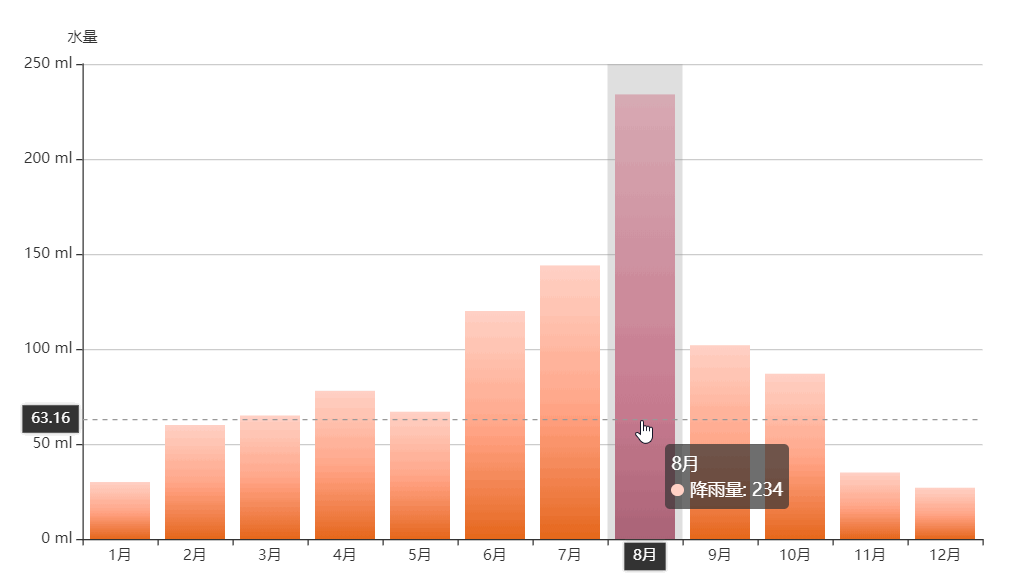
鼠标移动到柱状图上面时,效果图如下:


